
Science, Invention & Exploration
Florence Nightingale’s Other Instrument: A Persuasive Chart
Her diagrams made military mortality visible. The harder work was deciding what to count, how to compare it, and how to make an institution answer for the result.
A patient could receive a tray of food every day and still eat almost nothing. Florence Nightingale used precisely this kind of discrepancy to explain the difference between attending to a routine and observing a person. In Notes on Nursing, she contrasted a nurse who knew what every patient had actually consumed with one who repeatedly removed nearly untouched meals without noticing.
The distinction also helps explain her statistical work. A hospital could possess registers, officers, stores, and rules without producing knowledge that revealed where its system was failing. Counting was essential. Knowing what the count represented was more demanding.
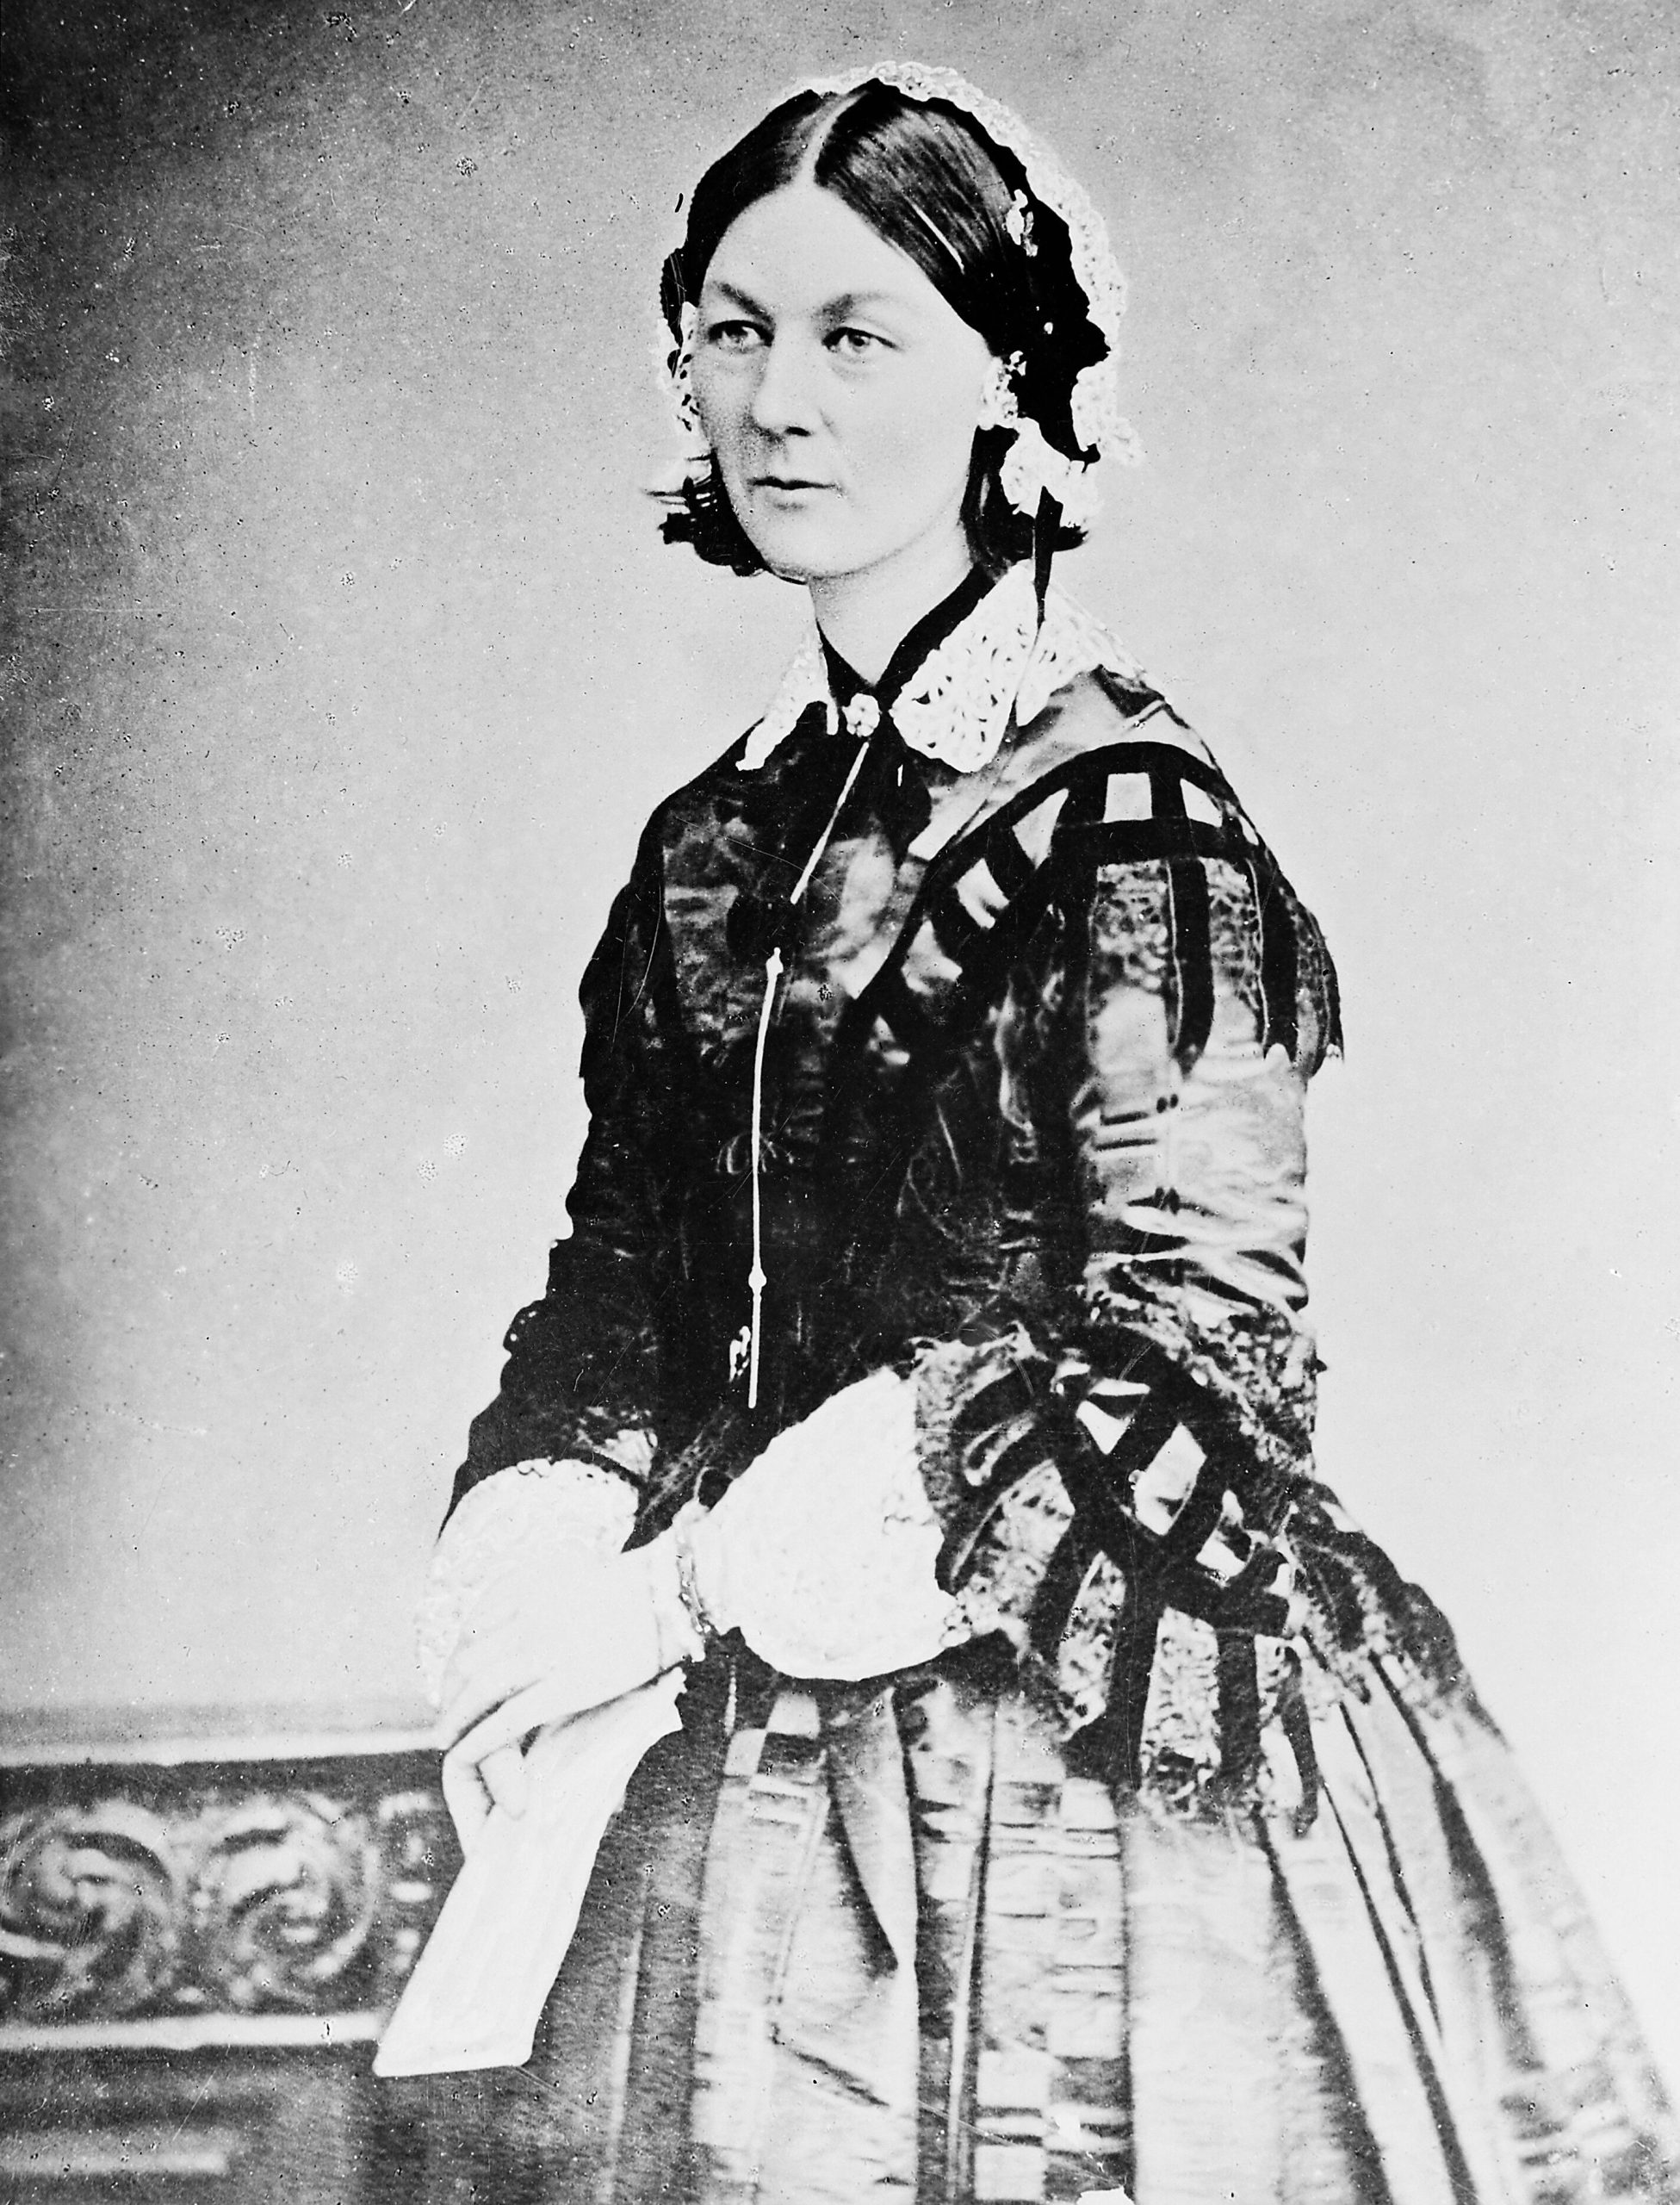
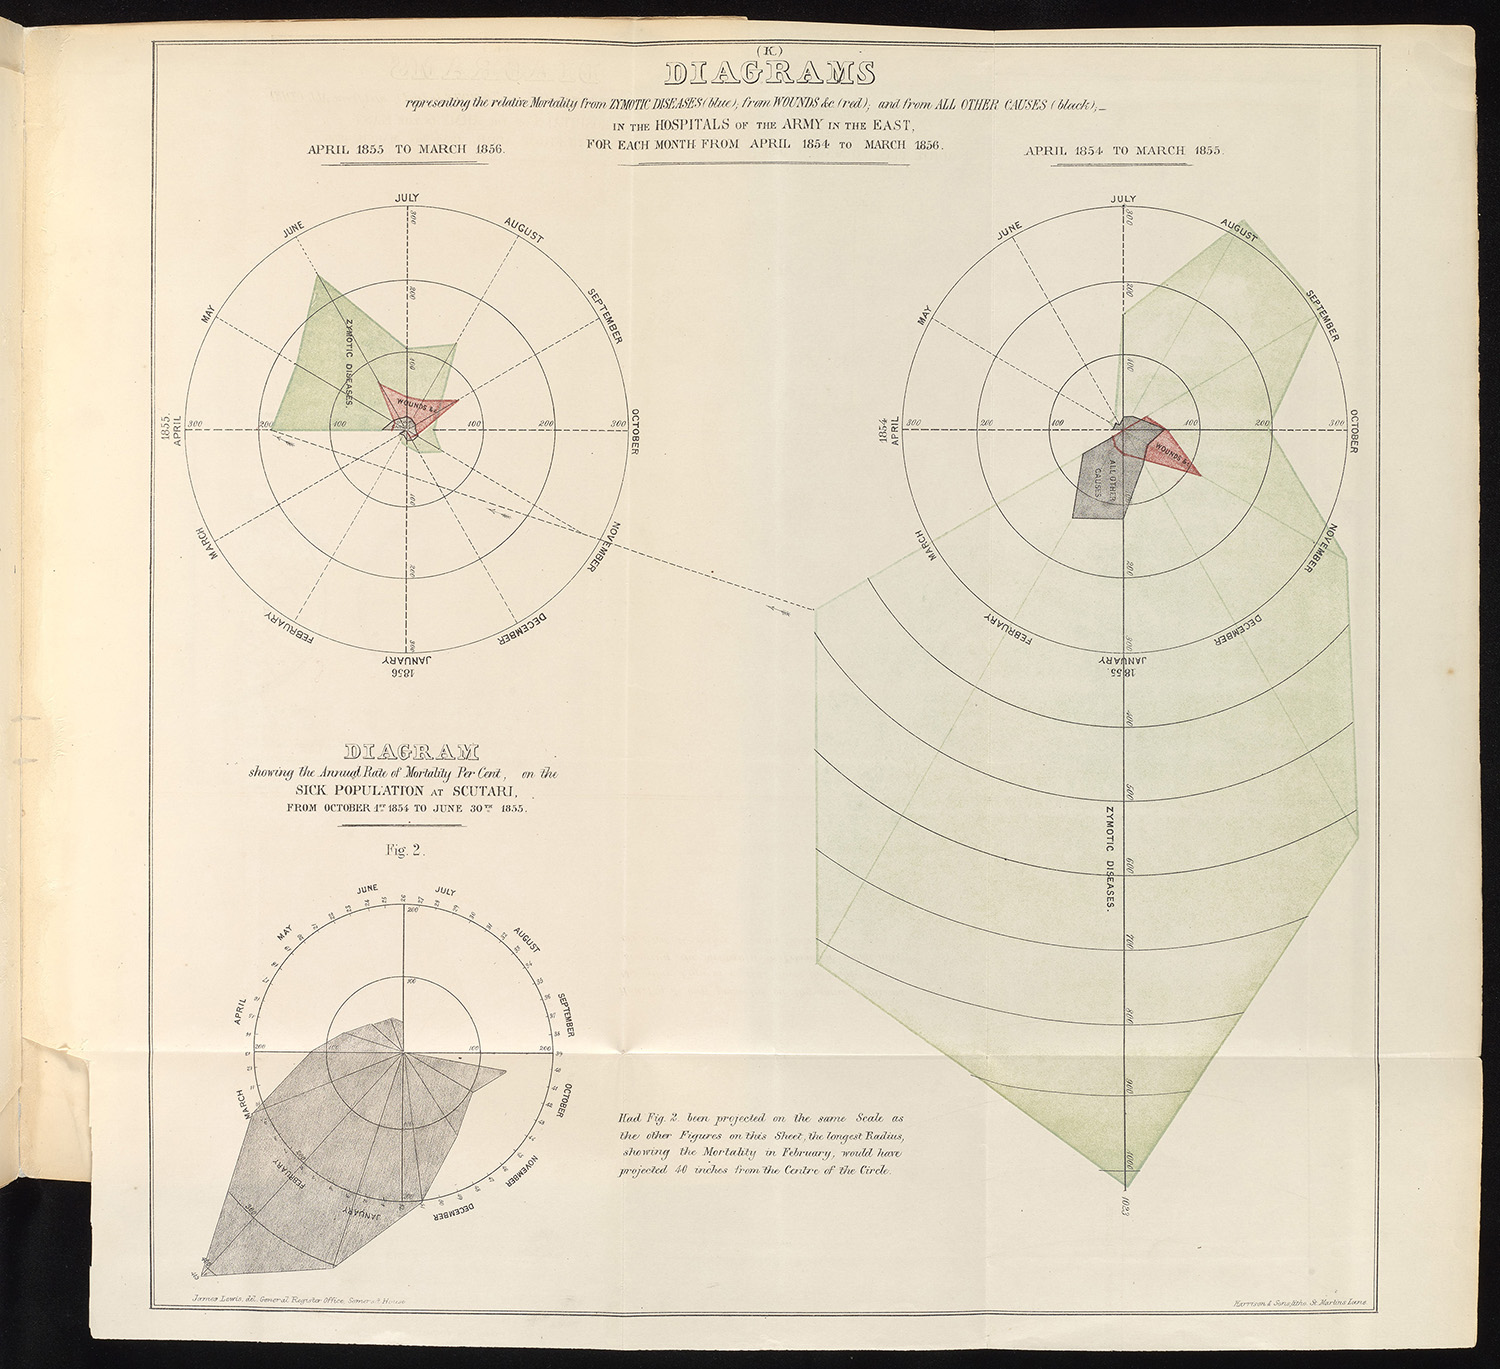
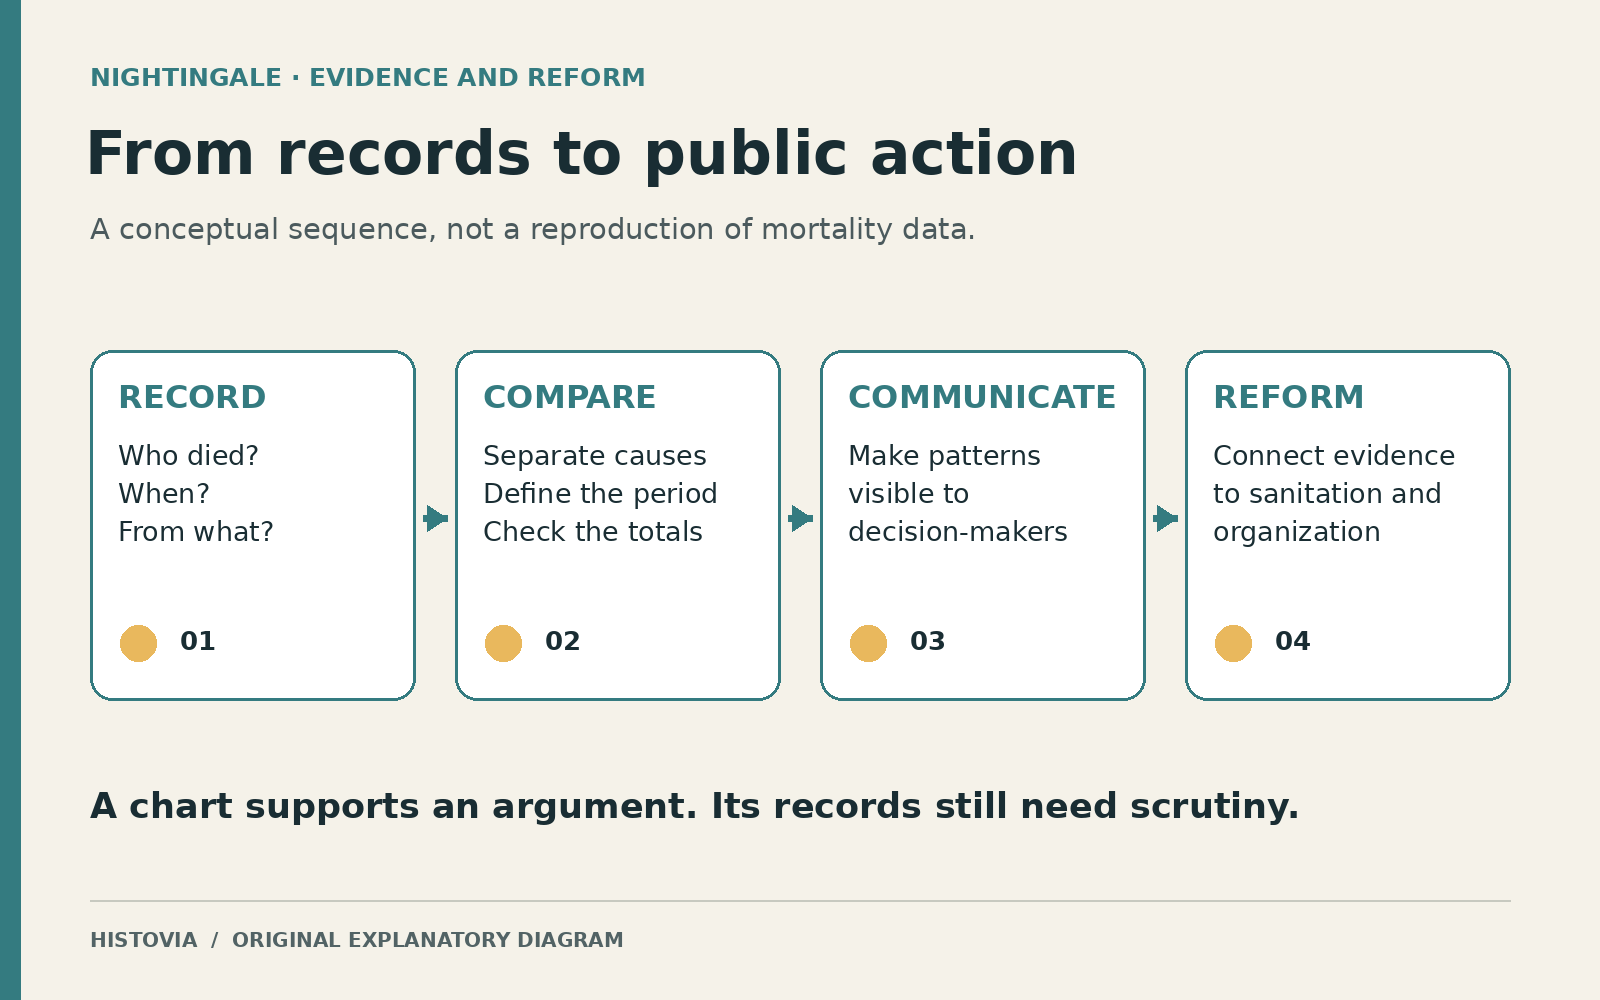
Nightingale’s best-known statistical image, the circular diagram of mortality in the British army during the Crimean War, made disease deaths impossible to overlook. Its striking shape can encourage a tidy story in which a brilliant woman drew a picture and politicians finally understood. The surviving evidence points to a longer process: observation, classification, comparison, argument, and an organized campaign to turn findings into administrative change.
The hospital could be part of the danger
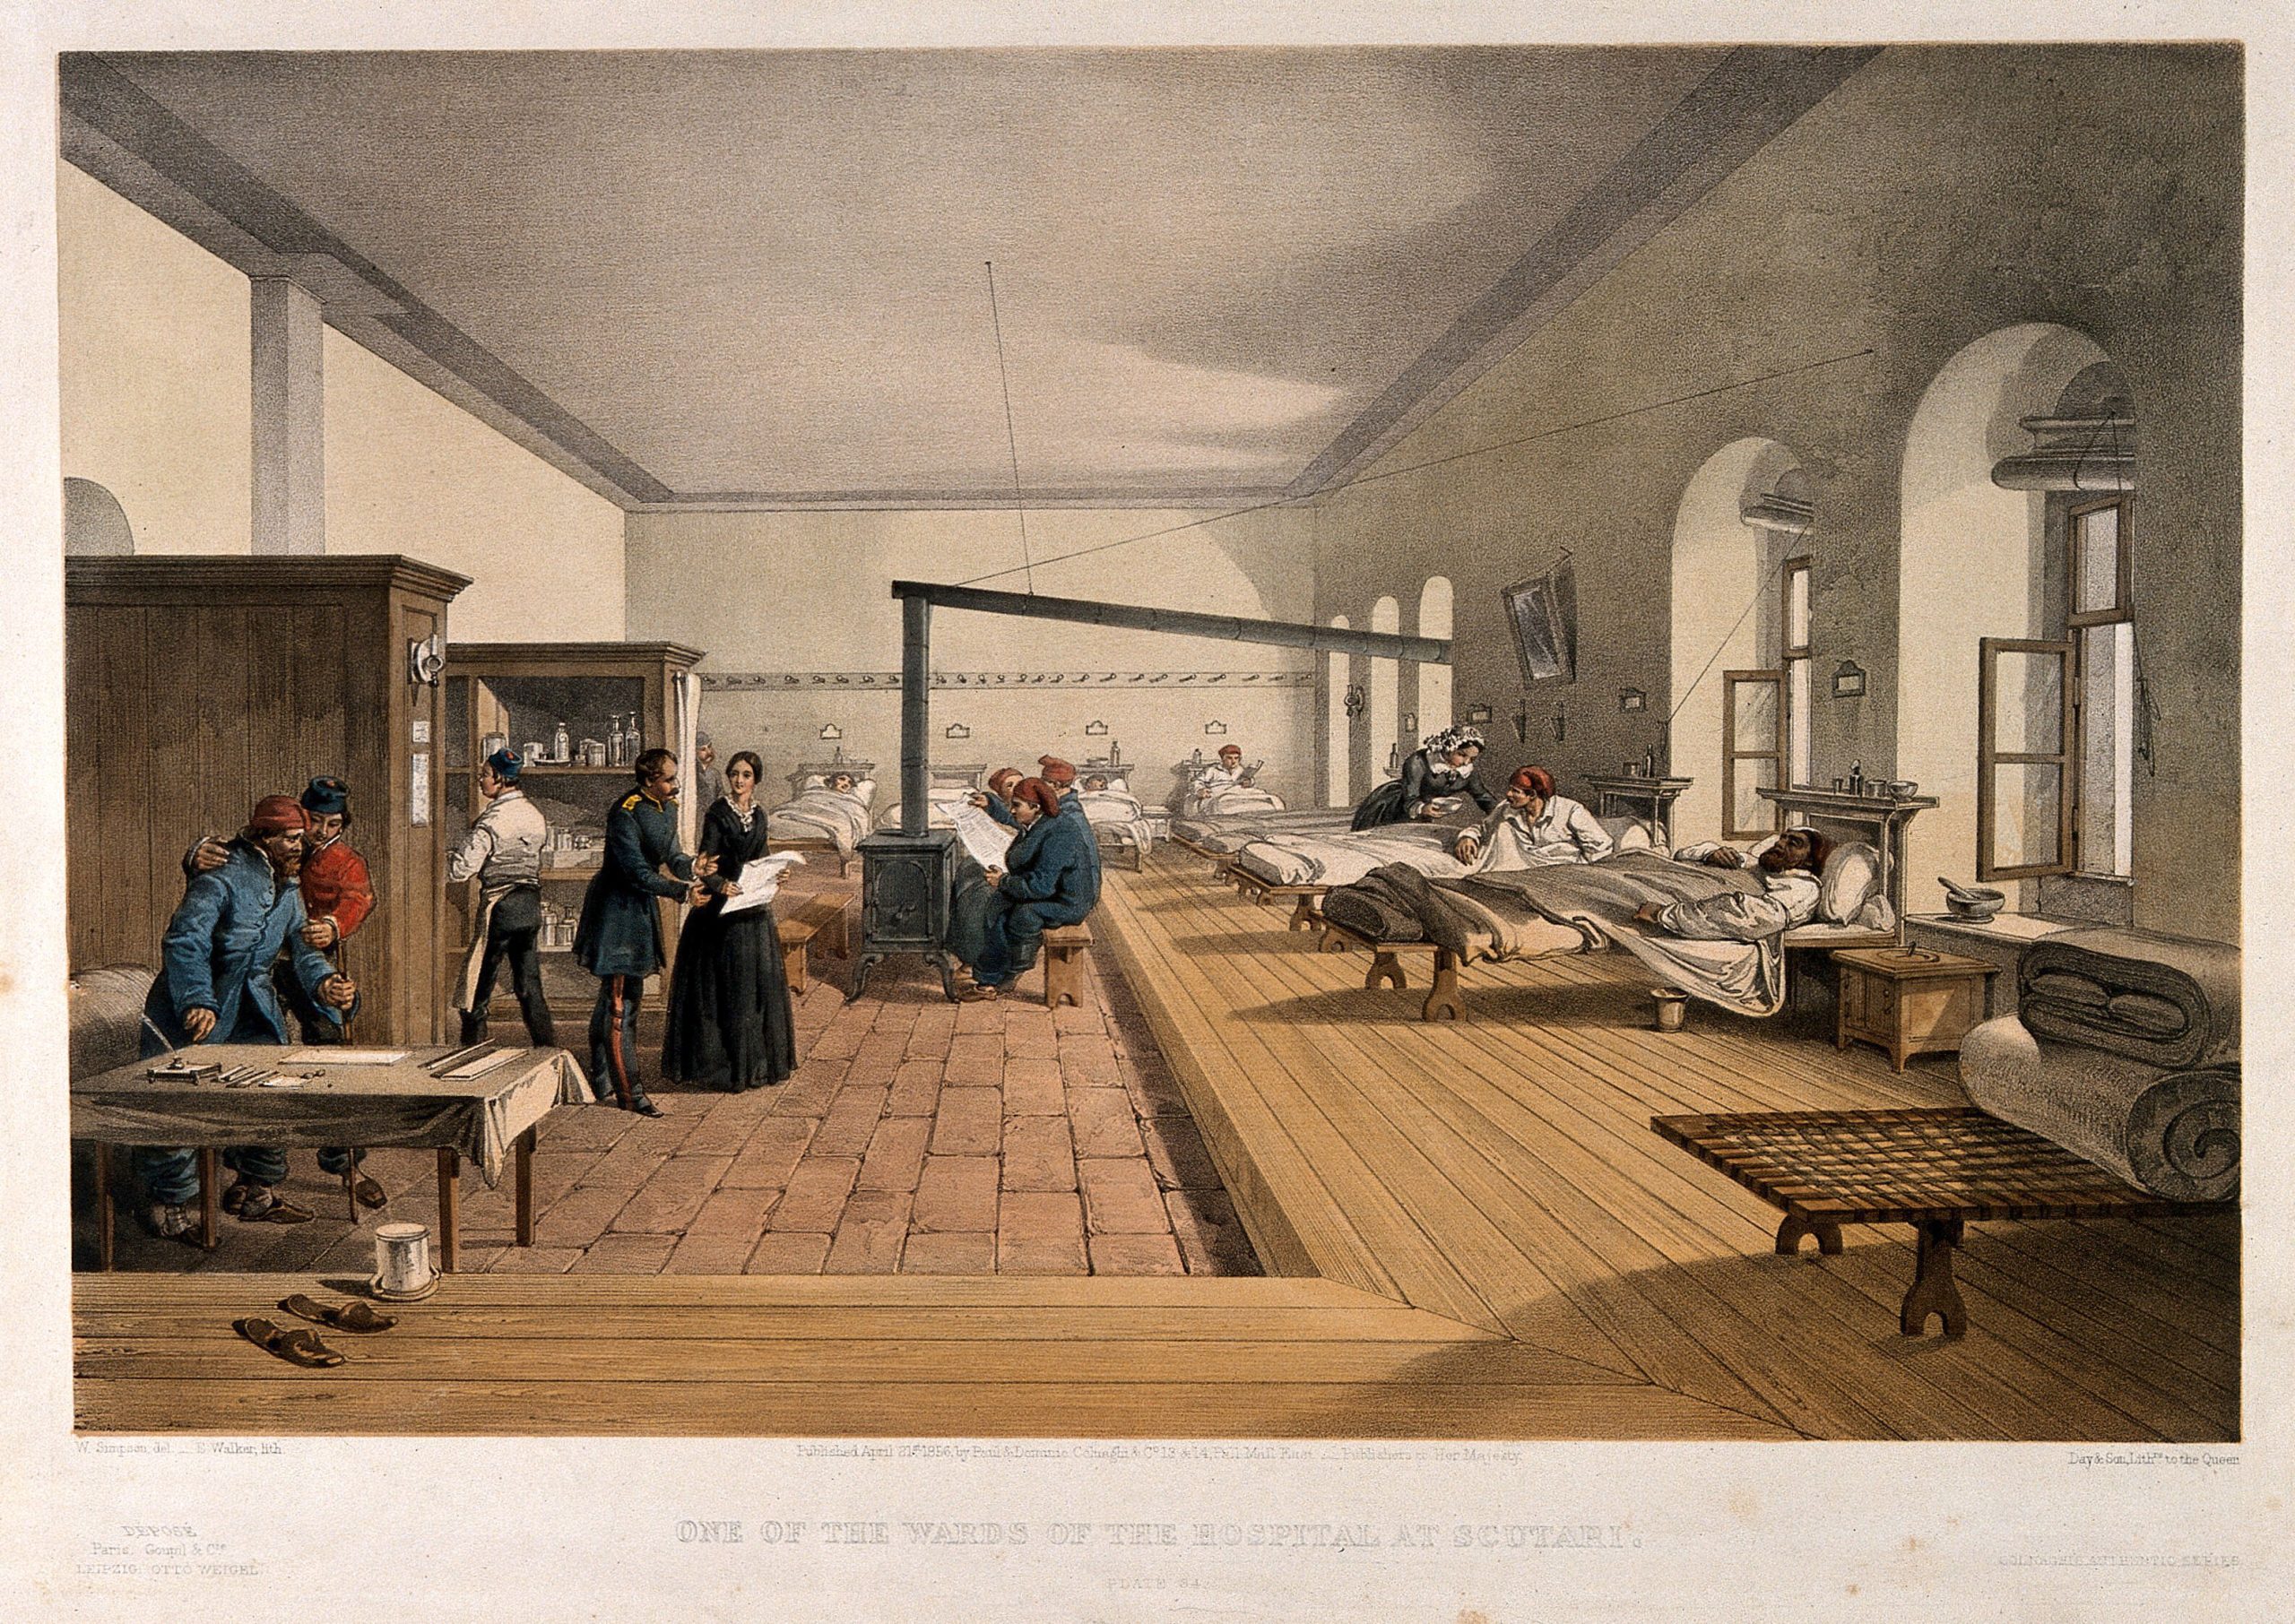
When Nightingale took a party of nurses to Turkey in 1854, the British military medical system faced a crisis that could not be solved by kindness at the bedside alone. Supplies, sanitation, transport, and overcrowded buildings all shaped what happened to sick and wounded soldiers. The National Army Museum’s account describes both her practical efforts and the importance of repairs undertaken by the Sanitary Commission. Those repairs matter because the familiar image of a solitary rescuer makes infrastructure and other workers disappear.
Her postwar investigation sharpened the uncomfortable possibility that places intended to heal were making patients less safe. That was a challenge to an institution’s account of itself. Deaths could not simply be placed in a general category called the unavoidable costs of war.
There were several different questions hidden inside the same disaster. Why had men become ill? Why had they been evacuated? What happened during transport? What conditions met them on arrival? A comparison that skipped these stages risked giving a confident answer to the wrong question.
What a circle could make visible
The famous polar-area diagram organized months around a center and used colored areas to distinguish causes of mortality. The repeated monthly structure let the viewer follow a changing pattern, while the contrast between disease and wounds challenged a battlefield-centered picture of military death. Historical versions of Nightingale’s graphics differ, so the title, date, legend, and method of encoding quantity must be read rather than assumed.
Duke University’s copy of the 1858 diagrams identifies the categories as zymotic diseases, wounds, and other causes. “Zymotic” belongs to nineteenth-century medical classification; it is not a label to transplant uncritically into a modern clinical dataset. The diagram recorded an argument using the categories available to its makers.
The visual form did useful intellectual work. It allowed a reader to see differences across time and causes without first reconstructing the pattern from columns of figures. But a diagram does not relieve its audience of reading. Area and radius are not interchangeable quantities, and an arresting shape can mislead if its scale is misunderstood. The Mathematical Association of America’s presentation of the 1858 report also shows bar graphs: the circular image was one device within a larger repertoire, not the entire statistical method.
It is worth separating two achievements. A chart can make an imbalance perceptible; establishing why that imbalance occurred requires additional evidence. Nightingale wanted both a compelling presentation and a case for changing conditions. Treating the picture as self-sufficient would erase much of the investigation that gave it force.
The denominator is part of the story
In a 2020 re-examination of the Scutari evidence, historian Hugh Small discusses Nightingale’s comparison of hospital outcomes in Turkey and Crimea. His analysis in Significance also identifies uncertainties: admissions may include repeat cases, and patients sent to different hospitals were not necessarily comparable. The surviving records cannot eliminate every possibility that the severity of transferred cases influenced the results. Small nevertheless argues that the evidence supports Nightingale’s concern about the receiving hospitals.
That qualification strengthens the historical question rather than making it disappear. If one hospital receives sicker patients, a higher death rate cannot automatically be blamed on its care. Equally, a difficult intake does not establish that conditions inside the hospital were harmless. Both propositions can be true. The investigation has to distinguish them.
A percentage conceals these choices behind a small, apparently finished number. Who enters the denominator? Is the unit a person or an admission? Does the period include the same months? Are deaths during a journey counted with the departure point, the destination, or somewhere else? These are not cosmetic questions about presentation. They determine what a comparison can legitimately mean.
Nightingale’s own nursing manual had already made a related warning in direct terms. Comparing hospitals without attending to patients’ ages, sex, and diseases, she argued, produced worthless comparisons. The passage in Notes on Nursing appears amid a discussion of the careless analogies people offered to sick friends. The movement from a household conversation to hospital statistics is revealing. In each setting, resemblance had to be established, not merely asserted.
Before the chart came the question
Much of the manual’s chapter on observation concerns questions that sound sensible but do not yield precise information. Asking whether someone had a good night could produce the same answer from people who meant very different things. Asking about hours of sleep and when those hours occurred was more useful. A report of appetite could similarly confuse desire for food with the ability to digest it.
Nightingale’s examples show information being distorted before anyone performs a calculation. A question leads the witness; a routine substitutes for the event it is supposed to record; an observer remembers an impression instead of a change. The patient may be too tired or reluctant to correct the account. The error then acquires authority because it arrives as a confident report.
Her answer was to make observation a trained responsibility. Devotion alone was insufficient. A nurse had to distinguish important changes from irrelevant ones and communicate what had actually happened. The observer was not a passive vessel through which facts passed. Skill determined whether useful facts were recognized at all.
This is also why her statistical legacy cannot be reduced to an attractive visualization. The polished final image begins with a less picturesque discipline: noticing the meal that returns untouched, distinguishing sleep from an assurance of sleep, and resisting an easy comparison between dissimilar cases. A better chart cannot repair a record that has already lost the distinction that matters.
The manual remains a historical source, not current medical guidance. Its recommendations and explanations belong to nineteenth-century medicine and include ideas now rejected. What is being examined here is its account of observation and institutional responsibility, not an invitation to follow its treatments or dietary advice.
Finding readers beyond the report
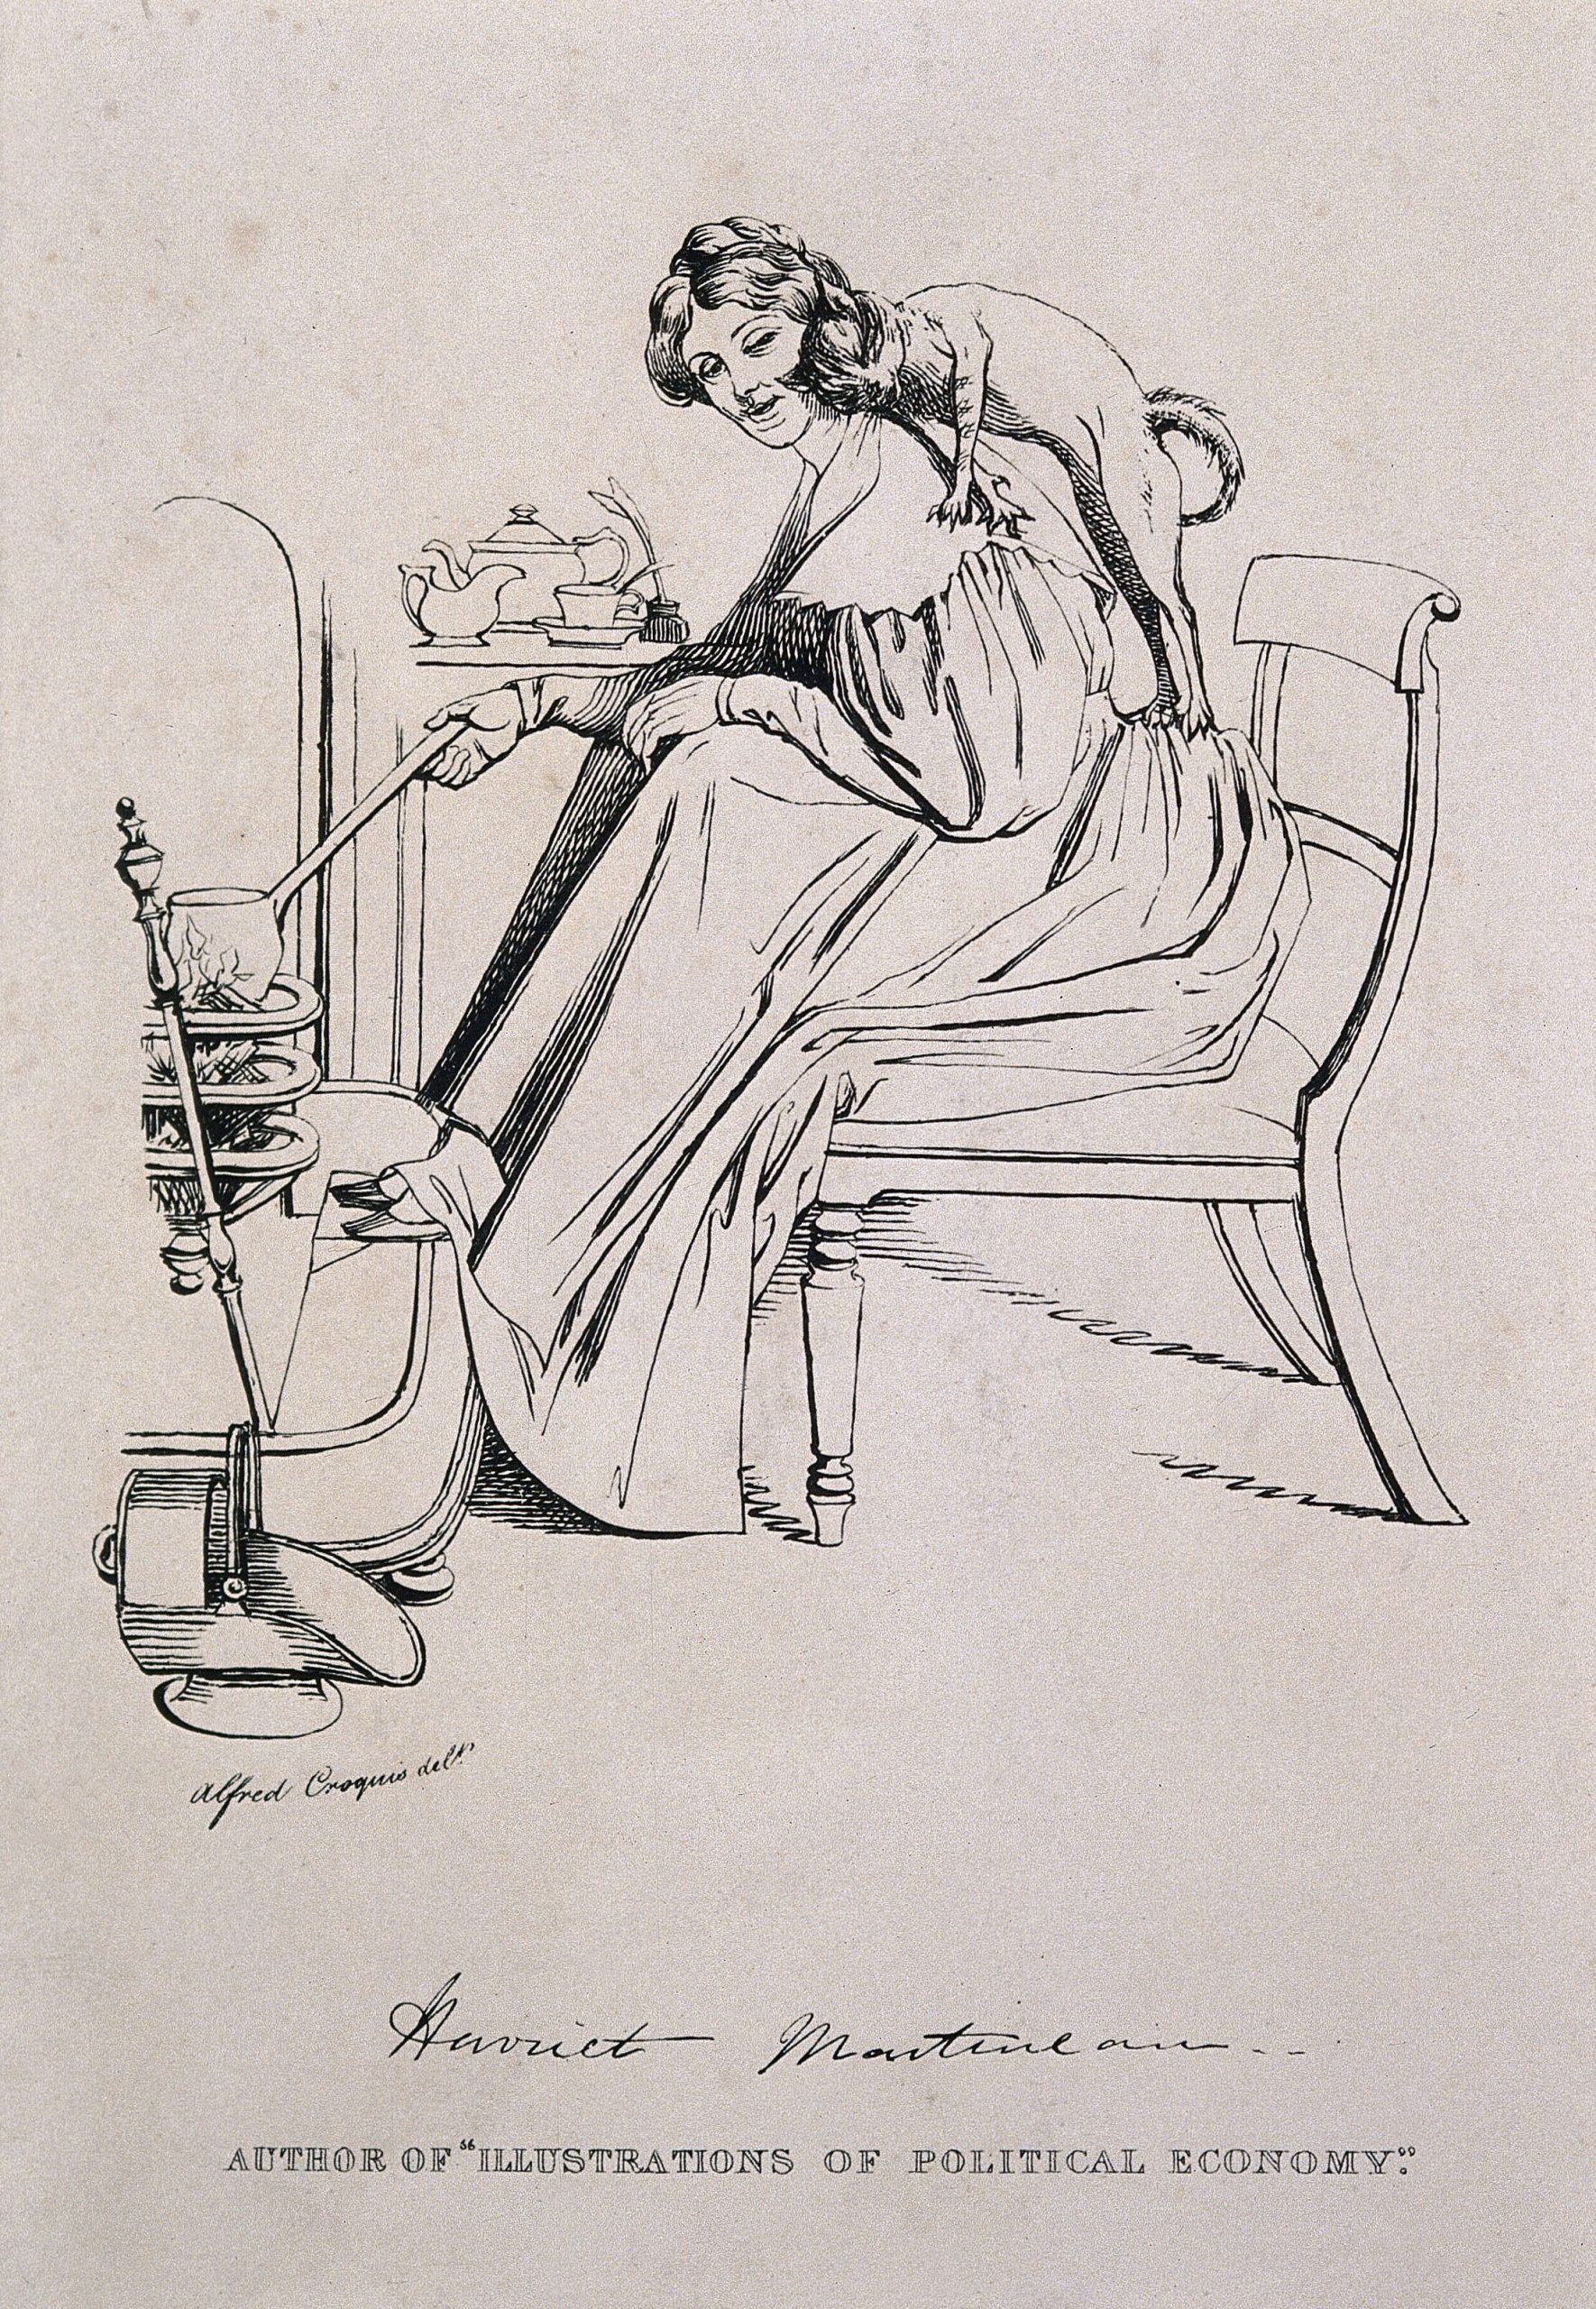
Evidence still needed an audience. Nightingale worked with Harriet Martineau on England and her Soldiers, published in 1859, bringing statistical findings into a narrative intended for readers beyond an official inquiry. Iris Veysey’s study in the Science Museum Group Journal explains the collaboration and the place of the mortality diagram within it. Martineau supplied a literary route into an administrative problem; Nightingale’s investigations supplied much of its evidential foundation.
The partnership matters because public persuasion required more than reducing a table to a picture. A reader needed to understand what soldiers experienced and which arrangements might be altered. As the Cambridge edition’s description and contents indicate, the book followed life through barracks, campaigning, hospitals, and proposals for improvement. The sequence located health within a system of living and working conditions.
This was advocacy, but advocacy does not by itself make evidence unreliable. It makes the relationship between evidence and desired change something the reader should inspect. A campaigner selects comparisons, arranges emphasis, and addresses particular decision-makers. The relevant test is whether the sources support the claims and whether competing explanations have been treated honestly, not whether the author cares about the outcome.
A record that required an answer
Nightingale’s subsequent reputation as a reformer and educator should not be flattened into the claim that a single diagram caused modern nursing or public health. The London School of Hygiene & Tropical Medicine’s biographical account places her writing and hospital-planning work within a much longer career. Institutions changed through people, money, rules, buildings, training, and political support as well as through arguments.
The chart’s importance lies partly in the kind of answer it demanded. If a large burden of death was associated with conditions capable of improvement, a report could no longer end at recording the loss. Someone had to explain the conditions and consider changing them. The visual argument made that obligation easier to grasp, while the underlying observations made it possible to investigate.
The untouched meal offers a smaller version of the same problem. A system can demonstrate that it has provided a service while failing to establish whether the service has worked. Nightingale’s scrutiny begins in that gap. Her diagram is memorable because it gives the gap a visible form; her investigations matter because they ask what produced it.